The first half of the year has given investors plenty to process—from banking turmoil to a morphing yield curve to the debt ceiling debate. Those with diversified portfolios of equities and fixed income were in a good position to benefit from both assets’ advances at the year’s midway point, a welcome turn from last year’s broad declines.
US stocks began 2023 with gains.1 Inflation showed signs of cooling, and the Federal Reserve paused in June after a series of rate increases. Regional banks and their holdings came under increased scrutiny in early March, and several lenders were sold to larger banks as some depositors fled. Around this time, US stocks began a decline, only to resume their ascent weeks later. That rally was led by technology stocks,2 whose surge coincided with increased attention on artificial intelligence and its potential.3 Value stocks and small caps started the year with gains, but growth stocks and large caps overtook them in the second quarter through mid-June.4 The bond market rebounded after one of its worst years in decades.5
Inflation continued to retreat from last year’s four-decade high, with the 12-month rise in US consumer prices falling to 4% in May.6 The reading a year earlier was more than double that. Fed officials paused on raising the benchmark federal funds rate in June after more than a year of increases, but signaled they were leaning toward resuming rate increases if inflation doesn’t cool further. The rapid rise in interest rates left some regional banks, such as Silicon Valley Bank, in precarious financial positions, resulting in three of the four largest bank failures on record (after Washington Mutual in 2008).7 Silicon Valley Bank ended up being sold to First Citizens Bank, and other lenders similarly found themselves with new owners.
A DEBT DIVERSION?
In Washington, politicians debated the US debt ceiling. After much back-and-forth, the president and Congress agreed on a deal to raise the debt limit in June, avoiding the impending possibility of a US default. Amid the discussions, stock and bond markets seemed to take the news in stride. While debt ceiling machinations can dominate headlines, the implications for investors are uncertain. The current deal imposes restraints on government spending for two years.
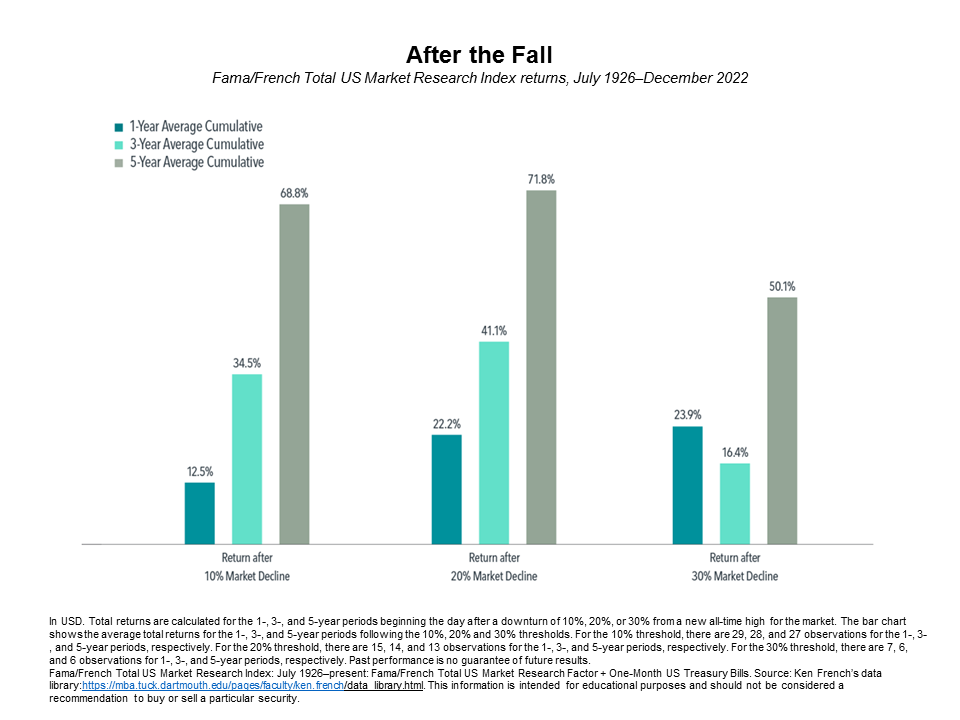
The S&P 5008 was up 15.8% through June 16, bouncing back from a two-year low in October and shifting from bear-market to bull-market mode upon reaching a 20% gain from the prior trough. Historically, US equity returns following sharp downturns have, on average, been positive. A broad market index tracking data from 1926–2022 in the US9 shows that stocks tended to continue to deliver positive returns even after the initial recovery from a bear market, or a decline of 20% (see chart below.)
Among the strongest performers so far in 2023 have been technology stocks, recovering after a poor showing in 2022. The tech-heavy Nasdaq has risen 30.8% through mid-June. Much of the stock market’s gain can be attributed to just a handful of companies, led by NVIDIA, which saw strong chip sales as interest in AI built.10
Global stock markets also bounced back after posting their worst year since the financial crisis. Global equities, as measured by the MSCI All Country World Index, rose 14.2% through mid-June. Developed international stocks, as represented by the MSCI World ex USA Index, added 13.0%, while emerging markets lagged, with the MSCI Emerging Markets Index up only 8.8%.
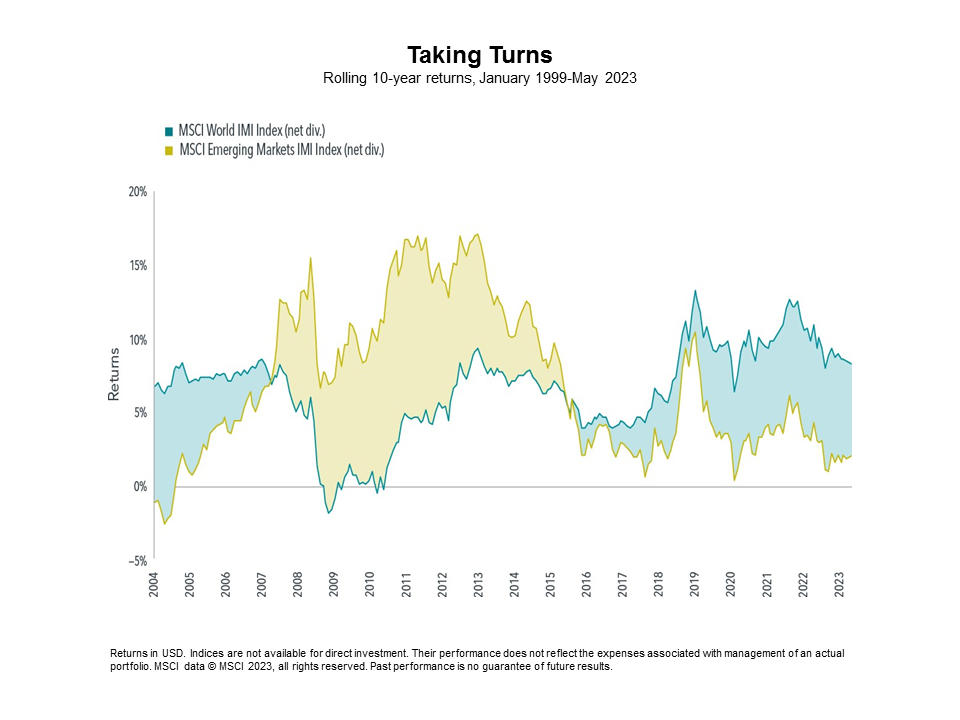
Recent history reminds us that emerging markets can be volatile, but they represent a meaningful piece of the investment opportunity set, accounting for more than 11% of the total global equity market11 and providing potentially valuable diversification for an investor’s portfolio. Earlier this century, the strong performance of emerging markets in a sense offset the weaker performance of developed markets (see chart below). In recent years, though, the returns of emerging markets have lagged behind those of developed markets. But taking the long view on the opportunities emerging markets hold can be a benefit for disciplined investors.
Globally, value stocks and small caps started the year outperforming growth and large cap stocks, respectively, but underperformed across the full period.12 However, it’s important to keep value’s recent performance in context. Last year, value outperformed growth by the largest one-year margin since 2000. That turnaround rewarded investors who remained disciplined during the three-year slump for value that ended in June 2020. Meanwhile, large cap stocks have outpaced small caps so far in 2023. Historically, small caps and value stocks have outperformed over the long term.
US Treasuries rebounded after posting their worst annual return in decades last year. For more than six months, the yield on the 10-year government bond has been lower than that of three-month bills, keeping the yield curve inverted. Despite rising bond prices generally, yields (which fall when prices rise) were higher than they have been for most of the past decade.13
THE POWER OF MARKETS’ AGGREGATED INTELLIGENCE
Investor enthusiasm for artificial intelligence has been cited among the key drivers for tech stocks’ recent gains.14 But what does it mean for investing? Despite the promise of AI, we believe that there’s no reason to think it offers investors predictive capabilities.
Markets also aggregate information, but they are forward-looking, reflecting investors’ best estimate of an asset’s value in relation to future expected returns. That makes the market the world’s largest information-processing machine. Its “aggregated intelligence” adjusts as new information comes in, setting prices that buyers and sellers agree are fair for millions of stocks and bonds every day. AI has been around for a while and can be expected to continue to improve. But we’ve yet to see research that says anyone can outsmart the market—not even artificial intelligence.
With six months to go, some questions appear likely to capture investors’ attention for the second half of 2023. What’s ahead for the economy in the US and elsewhere? Will the new bull market charge ahead or take a breath? How long will investor enthusiasm last for all things AI? What investors do know is that markets will continue to quickly process information as it becomes available. A long-term plan, one focused on individual goals and built on confidence in market prices, can put investors in the best place for a good experience, whatever may be in store.
Our podcast, Wealthy Behavior, is a great way to stay up-to-date on today’s markets, economy, and our outlook direct from our President & CEO, Sammy Azzouz, and CIO, Bob Weisse each month. Be sure to listen and subscribe so you know when a new episode drops!
Sources: Dimensional Fund Advisors.
1. Based on S&P 500 index. S&P data © 2023 S&P Dow Jones Indices LLC, a division of S&P Global. All rights reserved. Indices are not available for direct investment.
2. Based on the S&P 500 Information Technology Index, which rose 41.6% vs. 15.8% for the S&P 500 Index.
3. Ari Levy, “The Tech Trade Is Back, Driven by A.I. Craze and Prospect of a Less Aggressive Fed,” CNBC, May 26, 2023.
4. Based on returns of MSCI All Country World Value Index, MSCI All Country World Growth Index, MSCI All Country World Small Cap
Index, and MSCI All Country World Index (large caps). MSCI data © MSCI 2023, all rights reserved.
5. As measured by benchmark US Treasuries, which posted one of their worst annual returns in decades in 2022: The Bloomberg US Treasury 10-Year Bond Index lost 16.3%. Data provided by Bloomberg.
6. Inflation data as defined by the Consumer Price Index (CPI) from the US Bureau of Labor Statistics.
7. Matthew Goldberg, “The 7 Largest Bank Failures in US History,” Bankrate, May 1, 2023.
8. S&P data © 2023 S&P Dow Jones Indices LLC, a division of S&P Global.
9. Fama/French Total US Market Research Index returns, July 1, 1926–December 31, 2022.
10. James Mackintosh, “Eight Megacap Stocks Make for a Funny Sort of Bull Market,” Wall Street Journal, June 7, 2023.
11. Emerging markets represented 11.4% by market capitalization of MSCI All Country World IMI Index as of December 31, 2022.
12. Based on returns of MSCI indices. MSCI data © MSCI 2023, all rights reserved.
13. “Market Yield on U.S. Treasury Securities at 10-Year Constant Maturity, Quoted on an Investment Basis,” Federal Reserve Bank of St. Louis, June 2023.
14. Levy, “The Tech Trade is Back,” CNBC, May 26, 2023.


