Key Observations
• Market volatility persisted in May as investors tried to digest potential Fed policy action in June and the possibility of a U.S. default should a deal not be reached to raise the debt limit.
• Significant progress toward a debt ceiling agreement was made in eleventh hour of the month (and ultimately signed into law on June 3rd).
• Most market indexes posted negative returns, with limited bright spots in growth-oriented segments.
• Short-term rates remain higher than long-term and the U.S. yield curve remains inverted. Cash rates look attractive, but tactically timing the market based on yield ignores other factors when allocating fixed income assets.
May Market Recap
We’ve highlighted our theme of persistent heightened market volatility in our commentaries this year and May continued to deliver on that premise. Financial markets finally started to digest the regional banking turmoil from earlier in the year, a better-than-expected earnings season and a concentrated growth rally fueled by optimism in the AI industry helped propel U.S. equities for the first half of the month.
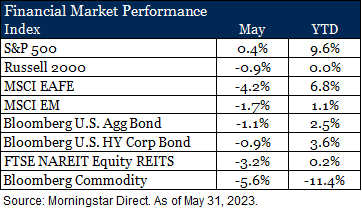
However, as the month progressed, concerns of the U.S. Treasury running out of money in June heated up and a shift in sentiment to more hawkish Fed actions to come stalled markets. Economic data trended a bit lower with weaker manufacturing PMI numbers reported from China and the U.S., increasing investor concerns of slower economic activity in the back half of the year and fueling the selloff in equities toward the end of the month. A stronger dollar was an additional headwind for non-U.S. investments. More economically sensitive areas such as REITs and commodities also came under pressure. REITs continue to be driven lower by the office segment while a reduced outlook for global demand weighed on commodity prices.
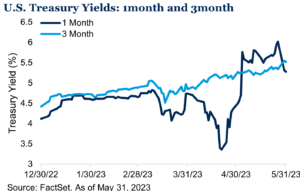
Fixed income markets were negatively impacted by rising interest rates and additional volatility on the front end of the U.S. yield curve was sparked by growing concerns of potential default if Congress did not come to an agreement to raise the debt limit. The yield on 1-month Treasury bills spiked early in the month as a result, but settled back as negotiations took an optimistic turn for a deal to be reached by the June 5 “x-date” in the last few days of the month.
Is Cash the Best Place to Be?
The U.S. yield curve remains inverted as investors are more concerned about economic risks in the near-term than the long-term. In the current interest rate environment – short-term rates higher than long-term rates – there are many wondering “why invest in longer duration assets when cash yields more?” At the surface the answer seems obvious, invest in the higher yielding asset, but there are more factors to consider than just yield itself. Time horizon and the investment objective for the assets, to name a few, are other important elements to evaluate. Cash can certainly have a place in portfolios for investors that have short-term needs where protecting principal is paramount but, for a more typical horizon over multiple years, cash often proves suboptimal as bonds tend to provide higher total returns over the long-term. In fact, since 1978, the Bloomberg Aggregate Bond Index outperforms cash (as measured by the ICE BofA US 3M TBill Index) approximately 67% of the time on a rolling 1-year basis and that figure jumps to 89% if we expand the rolling period to three years.*
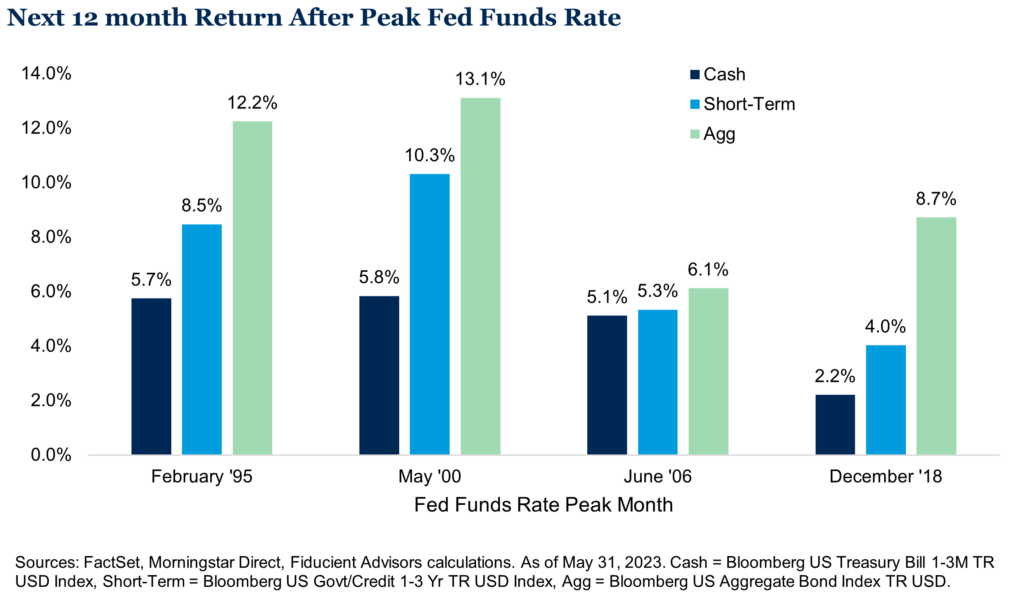
If positioning in cash is less focused on the long-term and more about the potential change in interest rates, we would also suggest evaluating that stance. We do not believe in timing interest rates, but we feel we are closer to the end of this interest rate hiking cycle than the beginning. Historically the prospects for traditional fixed income compared to cash when rates peak looks appealing. Following the month of the peak Fed Funds Rate, longer duration fixed income assets have outperformed cash over the following year, often by a wide margin.
Finally, given the growing risk of economic contraction, having exposure to high quality duration may be beneficial in a flight to quality environment to help diversify the portfolio. Since 1990, bonds have outperformed cash 67% of the time if the S&P 500 Index falls 15% or more peak-to-trough, with an average margin of outperformance of 1.6%.** We often say cash is good at protecting itself since it is stable in both up and down markets. However, bonds may be better at protecting the portfolio as they have often performed their best when risk assets perform their worst.
Outlook
Uncertainty is a large underpinning of what drives volatility in markets. With the debt ceiling agreement now passed, the rising prospect of a slowing business cycle is now at the forefront of investors’ minds. Our views and themes of continued volatility as we move into a new interest rate regime and moderating inflation remain intact. We believe our long-term strategic views and positioning updates at the beginning of the year reinforce the foundations of our portfolios as we move into the back half of the year in an environment with tighter financial conditions.
*Morningstar Direct, Fiducient Advisors calculations. As of May 31, 2023.
**FactSet, Yardeni Research, Morningstar Direct, Fiducient Advisors calculations. Data from January 1990 to October 2022.


