Nearly 200 years ago, the U.S. was debt-free.
Our then-President, who thought buying something on credit was like “black magic”, decided to pay off the national debt. And he did it. In today’s world, most of us couldn’t imagine ourselves or our country being debt-free. Andrew Jackson is a testament to the power of making a plan.
That’s just one of the interesting stories that came from this Advisor Channel article that charts 200+ years of interest rate history.
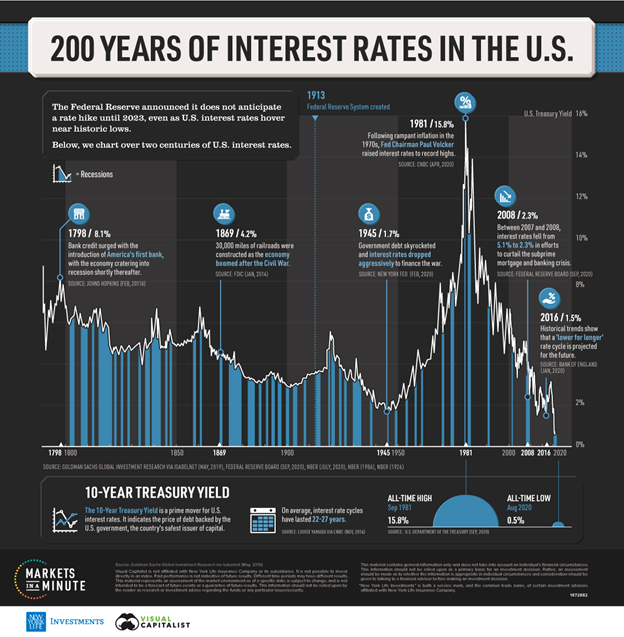
But interesting facts aside, there’s a lot of insight to be gained from this chart about interest rates and bond investing.
1. Rate cycles are long. 22-27 years long based on history. This is much longer than the typical stock market cycle which has averaged about 4.5 years.
2. A rising rate environment can quickly turn into a falling rate environment. But the shift from low/falling rates to a rising rate trend can be much more gradual.
3. Today’s rates are the lowest in this 200-year history, but the next lowest rate environment was during WW II when government spending skyrocketed to fund the war.
So, what can serious investors take away from all of this historical data?
Surprises are unlikely.
Some headlines say, “lower for longer”, while others claim rates must go higher in the face of all this recent stimulus. Any significant change in interest rates is likely to materialize over time, not overnight.
Income is also unlikely.
Investors that require yield to meet annual spending needs must look beyond U.S. government bonds to get any meaningful income.
Growth may be the silver lining.
Low interest rates are generally supportive for economic growth and stock prices. At the end of the day, total return is what determines if investors are staying on course to meet long-term goals.
At Heritage Financial, alternative sources of yield are an important part of our total portfolio approach to meeting clients’ long-term investment objectives. Interested in learning more about where we are currently finding attractive risk-adjusted yield? Let’s talk.


