Key Observations
• The S&P 500 entered a “correction”, defined as a pullback of 10% or more; intra-year corrections are not uncommon for equity markets.
• Fixed income continues to struggle based on a myriad of factors including Fed narrative, an illusive recession and higher issuance by the US Treasury.
• Small caps have struggled this year on a few simple narratives, but may offer unique opportunity relative to their large cap peers.
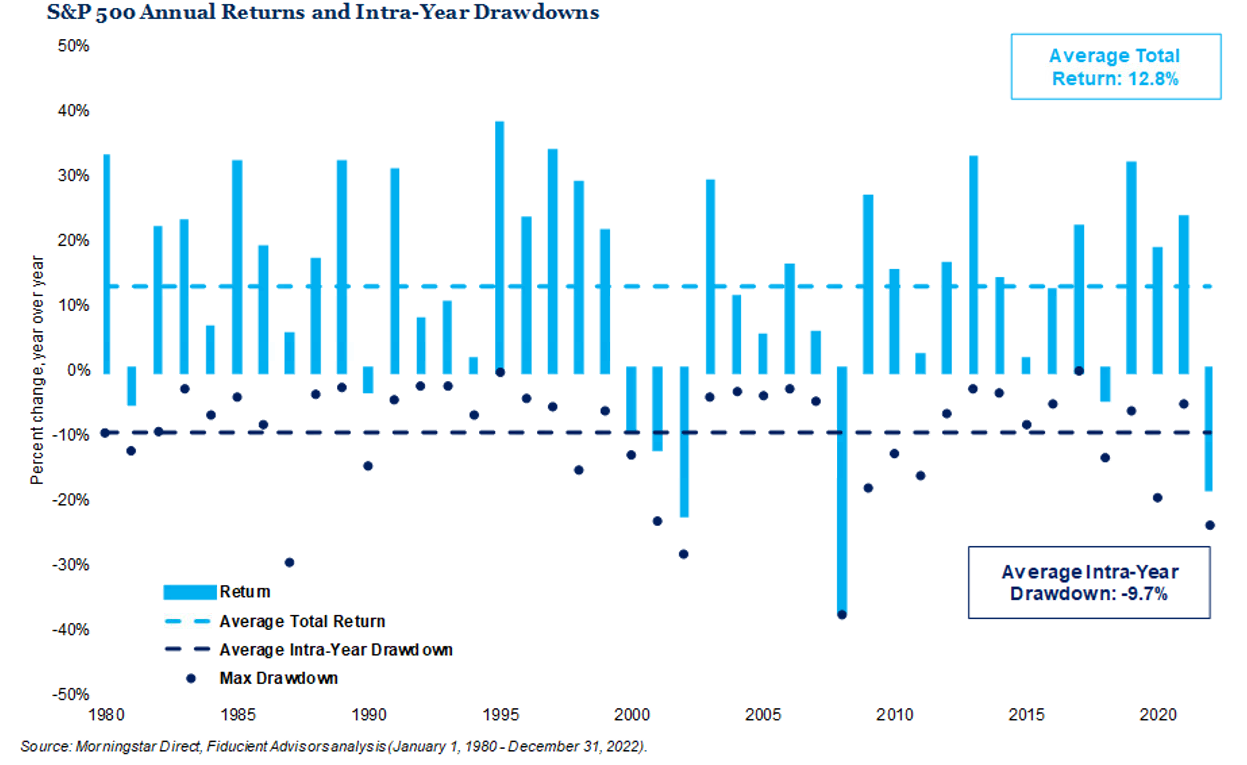
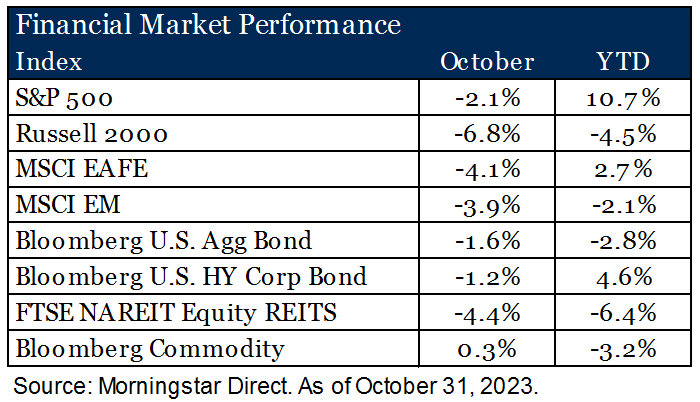 Markets across global equity and fixed income added a third month of decline in October. Technically, the S&P 500 entered a “correction”, defined as a pullback of 10% or more, since recent highs achieved in July. Intra-year declines of this magnitude are not uncommon and as demonstrated in the chart below, coincidentally align with the average intra-year decline on the S&P 500 since 1980. The recent struggles for fixed income are however less common. Should the Bloomberg U.S. Aggregate Bond Index close the year in negative territory it will be the first consecutive three-year decline since the creation of the aggregate index in the 1970s1. In particular, long duration bonds, as measured by the Bloomberg U.S. Long Gov/Credit, fell -4.5% over the month pushing its total return to -9.7% for the calendar year1. We believe several factors participated in driving bond prices lower. The Fed’s continued narrative of “higher for longer (interest rates)”, a rolling view of a coming recession that has yet to arrive, and several technical factors with the Fed engaged in quantitative tightening and increasing Treasury supply following months of inability to do so based on debt ceiling restrictions. The resulting higher yields will be a key point of discussion in our coming 2024 outlook as we review the forward-looking opportunity fixed income may offer long-term investors.
The S&P Sneezes & Small Caps Catch a Cold
Small cap U.S. stocks have struggled to find their footing this year. After a strong first quarter start, they were quickly overtaken by the buzz of Artificial Intelligence (AI) and the moniker of “the Mag Seven” was born. As markets and temperatures in the northern hemisphere have cooled it looks like the S&P may have sneezed, but it is small caps that caught a cold. What gives?
First it is instructive to note that the small cap index, defined as the Russell 2000, is not just a smaller clone of its larger sibling index. As a residual of the securities in each index, the sector weightings and complexion can differ materially from large and small cap indexes. As demonstrated below, the variance in sector weights have been up to 12% over the last three months. Moreover, the returns within a sector from large to small cap can vary considerably. By way of example, large cap healthcare outperformed small cap healthcare over the last three-months by 18.7%. Moreover, only two small cap sectors modestly outperformed their large cap peers over the same period. Closer examination of the recent period shows small caps have been plagued by both a higher exposure to poor performing sectors and materially worse sector returns. Small cap healthcare in particular has been hit by a combination of higher interest rates calling into question the viability of some businesses and weight loss drugs potentially leading to lower demand (read, lower obesity rates may produce less need for medical services).
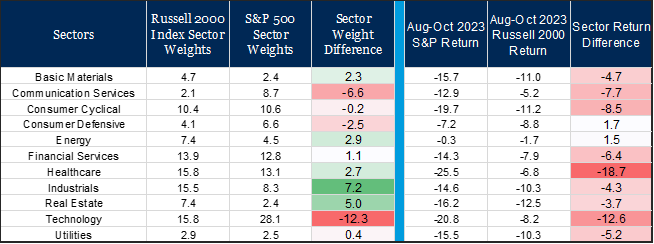
Source: Morningstar Direct as of October 31, 2023
However, as we zoom out from recent performance the relationship between small and large cap stocks is in an interesting place. Since 2003, small cap companies on average have traded at a 35% valuation premium relative to large cap indexes. This is on the premise of higher growth and therefore higher return potential. In fact, over the last 20 years the Russell 2000 index has grown its earnings per share (EPS) more than 2x that of the S&P 500. Yet, at present, large cap and small cap indexes are at near equal valuations. On a relative basis this makes small caps appear attractive to larger peers.
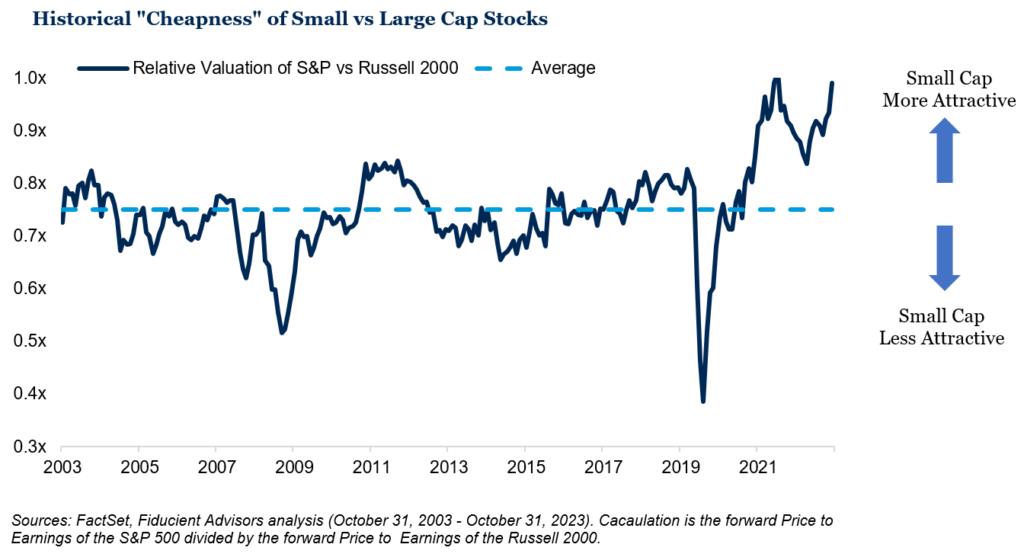
This narrative alone for small vs large caps is far too simple to be an investment thesis. For example, earnings per share (EPS) growth for the Russell 2000 over the last year was -24% whereas the S&P 500 was down -4% by comparison1. However, it does highlight an anomaly occurring with both the relative valuation and the concentration in the S&P 500 driven by the Mag Seven.
For more insight, be sure to listen to our latest Wealthy Behavior podcast where we share thoughts on the markets, what we’re confident in, watching for, and most concerned about. Click the link below, or listen on Apple Podcasts, Spotify, Google Podcasts, YouTube, or wherever you listen to podcasts. Be sure to subscribe so you don’t miss new episodes that drop twice per month!
1)Source: FactSet as of October 31, 2023


